
Systems
Dashboards
A Sorted Systems service. Review and complete the service-page fields before publishing.
What Sorted does
Practical help, built around your business.
Turn Business Data Into Clear, Useful Decisions
A business can collect plenty of information and still have very little visibility.
Sales figures sit in one spreadsheet, projects in another, follow-ups somewhere else, and important problems only become obvious when they are already urgent.
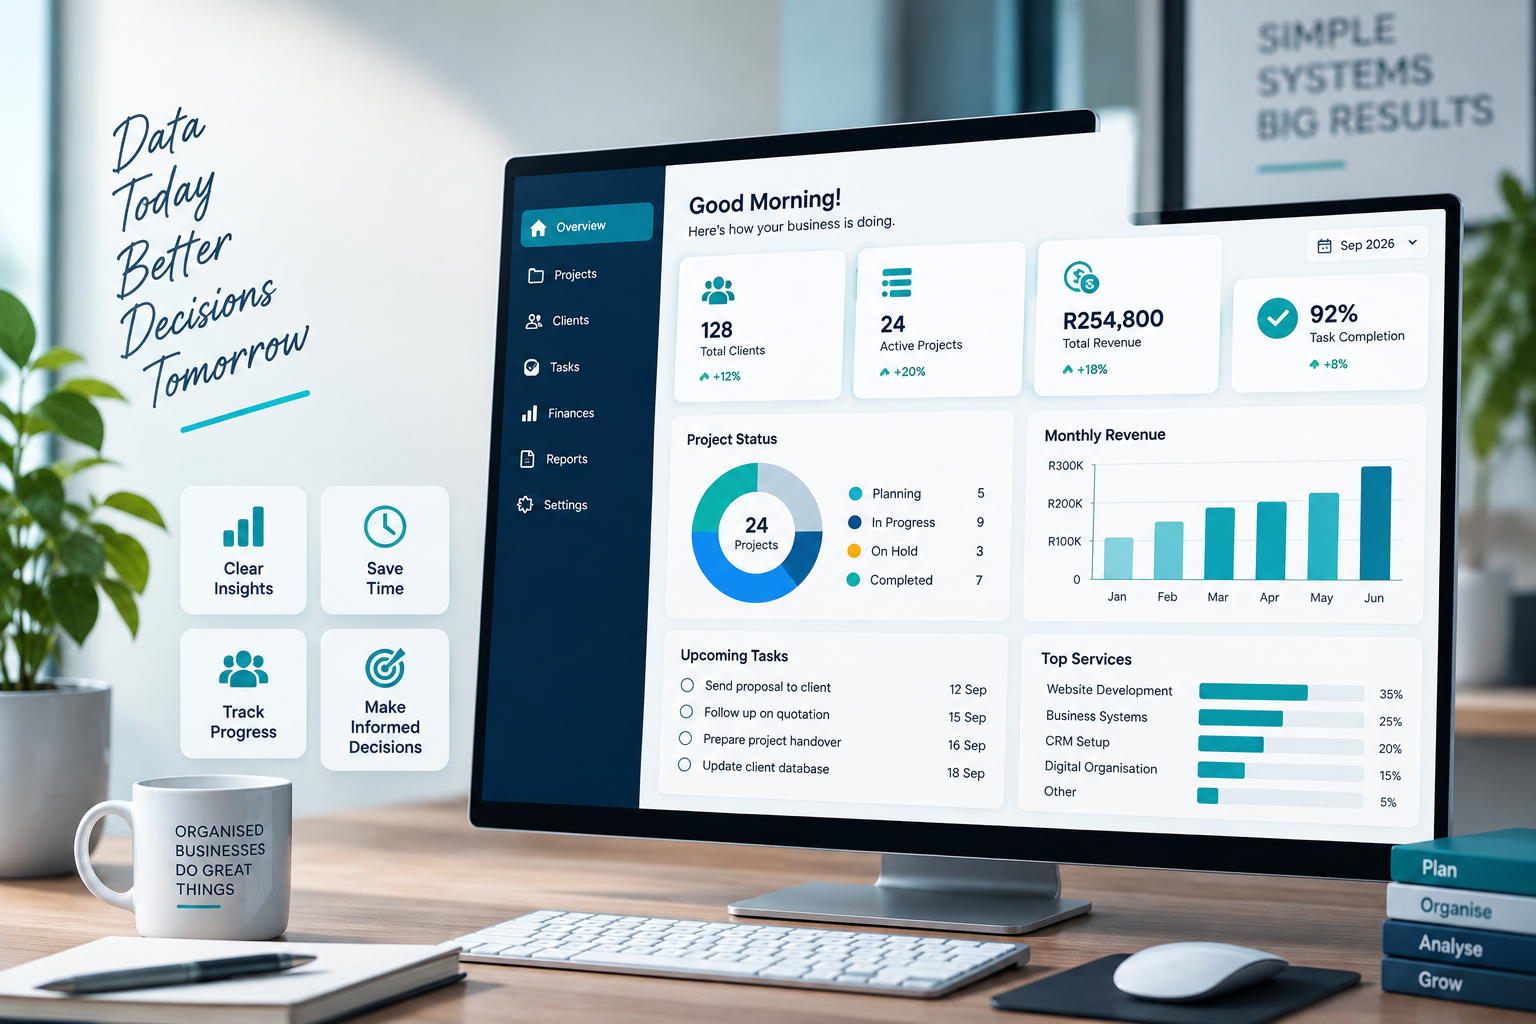
Sorted builds custom business dashboards that bring key information together into a clear visual view, helping you understand what is happening, what needs attention and what should happen next.
Our dashboards are designed around the questions your business actually needs answered, not around filling a screen with charts for decoration.
What a Dashboard Can Include
Depending on your business, your dashboard can include:
- Sales performance
- Lead tracking
- Customer activity
- Project progress
- Task status
- Outstanding follow-ups
- Revenue tracking
- Expense tracking
- Payment status
- Stock levels
- Low-stock alerts
- Staff workload
- Certificate expiry dates
- Warranty dates
- Upcoming deadlines
- KPI tracking
- Needs-attention items
- Monthly summaries
- Trends and comparisons
- Custom reports
- Filters and search tools
Who This Service Is For
Custom dashboards are ideal for businesses that:
- Have data but struggle to understand it quickly
- Use multiple spreadsheets
- Spend too much time compiling reports manually
- Need better visibility across projects or customers
- Want to track KPIs more clearly
- Need to spot overdue or outstanding items sooner
- Want management information in one place
- Need a clearer view of business performance
- Already have a database or CRM but need better reporting
We Start With the Questions, Not the Charts
A useful dashboard should answer real business questions.
Before building anything, we look at what you need to know regularly.
That may include:
- What needs attention today?
- Which projects are behind?
- Which customers need follow-up?
- What is selling?
- What is outstanding?
- Where are bottlenecks developing?
- Which deadlines are approaching?
- How is the business performing compared with last month?
- What information does management need at a glance?
Once those questions are clear, we decide which information should be displayed and how it should be presented.
Needs-Attention Dashboards
One of the most useful dashboard features is a clear Needs Attention view.
Instead of searching through every customer, project or spreadsheet, the dashboard can highlight items such as:
- Overdue follow-ups
- Late payments
- Stalled projects
- Missing information
- Low stock
- Unassigned tasks
- Expiring certificates
- Upcoming deadlines
This helps you focus on the parts of the business that actually require action.
Built Around the Systems You Already Use
You do not always need a completely new system to get better reporting.
Sorted can build dashboards around existing information stored in:
- Google Sheets
- Google Workspace
- Excel
- CRM systems
- Project trackers
- Customer databases
- Stock systems
- Custom business databases
Where the data is messy or inconsistent, we can also help clean and structure it before building the dashboard.
Clear Data, Not Dashboard Clutter
A dashboard should make information easier to understand.
It should not become another screen filled with numbers nobody looks at.
We focus on:
- Clear visual hierarchy
- Relevant KPIs
- Useful charts
- Simple status indicators
- Practical filters
- Easy-to-read summaries
- Information that leads to action
If a metric does not help you understand or manage the business, we question whether it needs to be there.
Our Philosophy
A dashboard should answer questions, not create more of them.
Sorted believes good reporting should help you quickly understand:
What is happening?
What needs attention?
What is changing?
What should I do next?
Our approach is:
Assess. Plan. Cut Out Waste. Build. Implement.
We use the data you already have, identify what matters, remove unnecessary noise and build a dashboard that makes the business easier to see.
The goal is:
Less digging.
Clearer priorities.
Better visibility.
Faster decisions.
More useful data.
The numbers are already telling a story.
We help you see it.
Get Your Business Dashboard Sorted
If your business has data but not enough visibility, we can help turn that information into a practical dashboard that is easier to understand and easier to use.
How it works
From assessment to implementation.
- 1Assess
- 2Plan
- 3Cut Out Waste
- 4Build
- 5Implement